Dashboard
The Dashboard is your home screen in Pitch N Hire and the first thing you see after signing in. It pulls every part of your hiring operation into one place, a real-time snapshot of candidates, applications, requisitions and open jobs, alongside the outcome metrics that tell you how healthy your pipeline really is. From here you can read the numbers, jump into reports, and launch your next action without leaving the page.
Overview
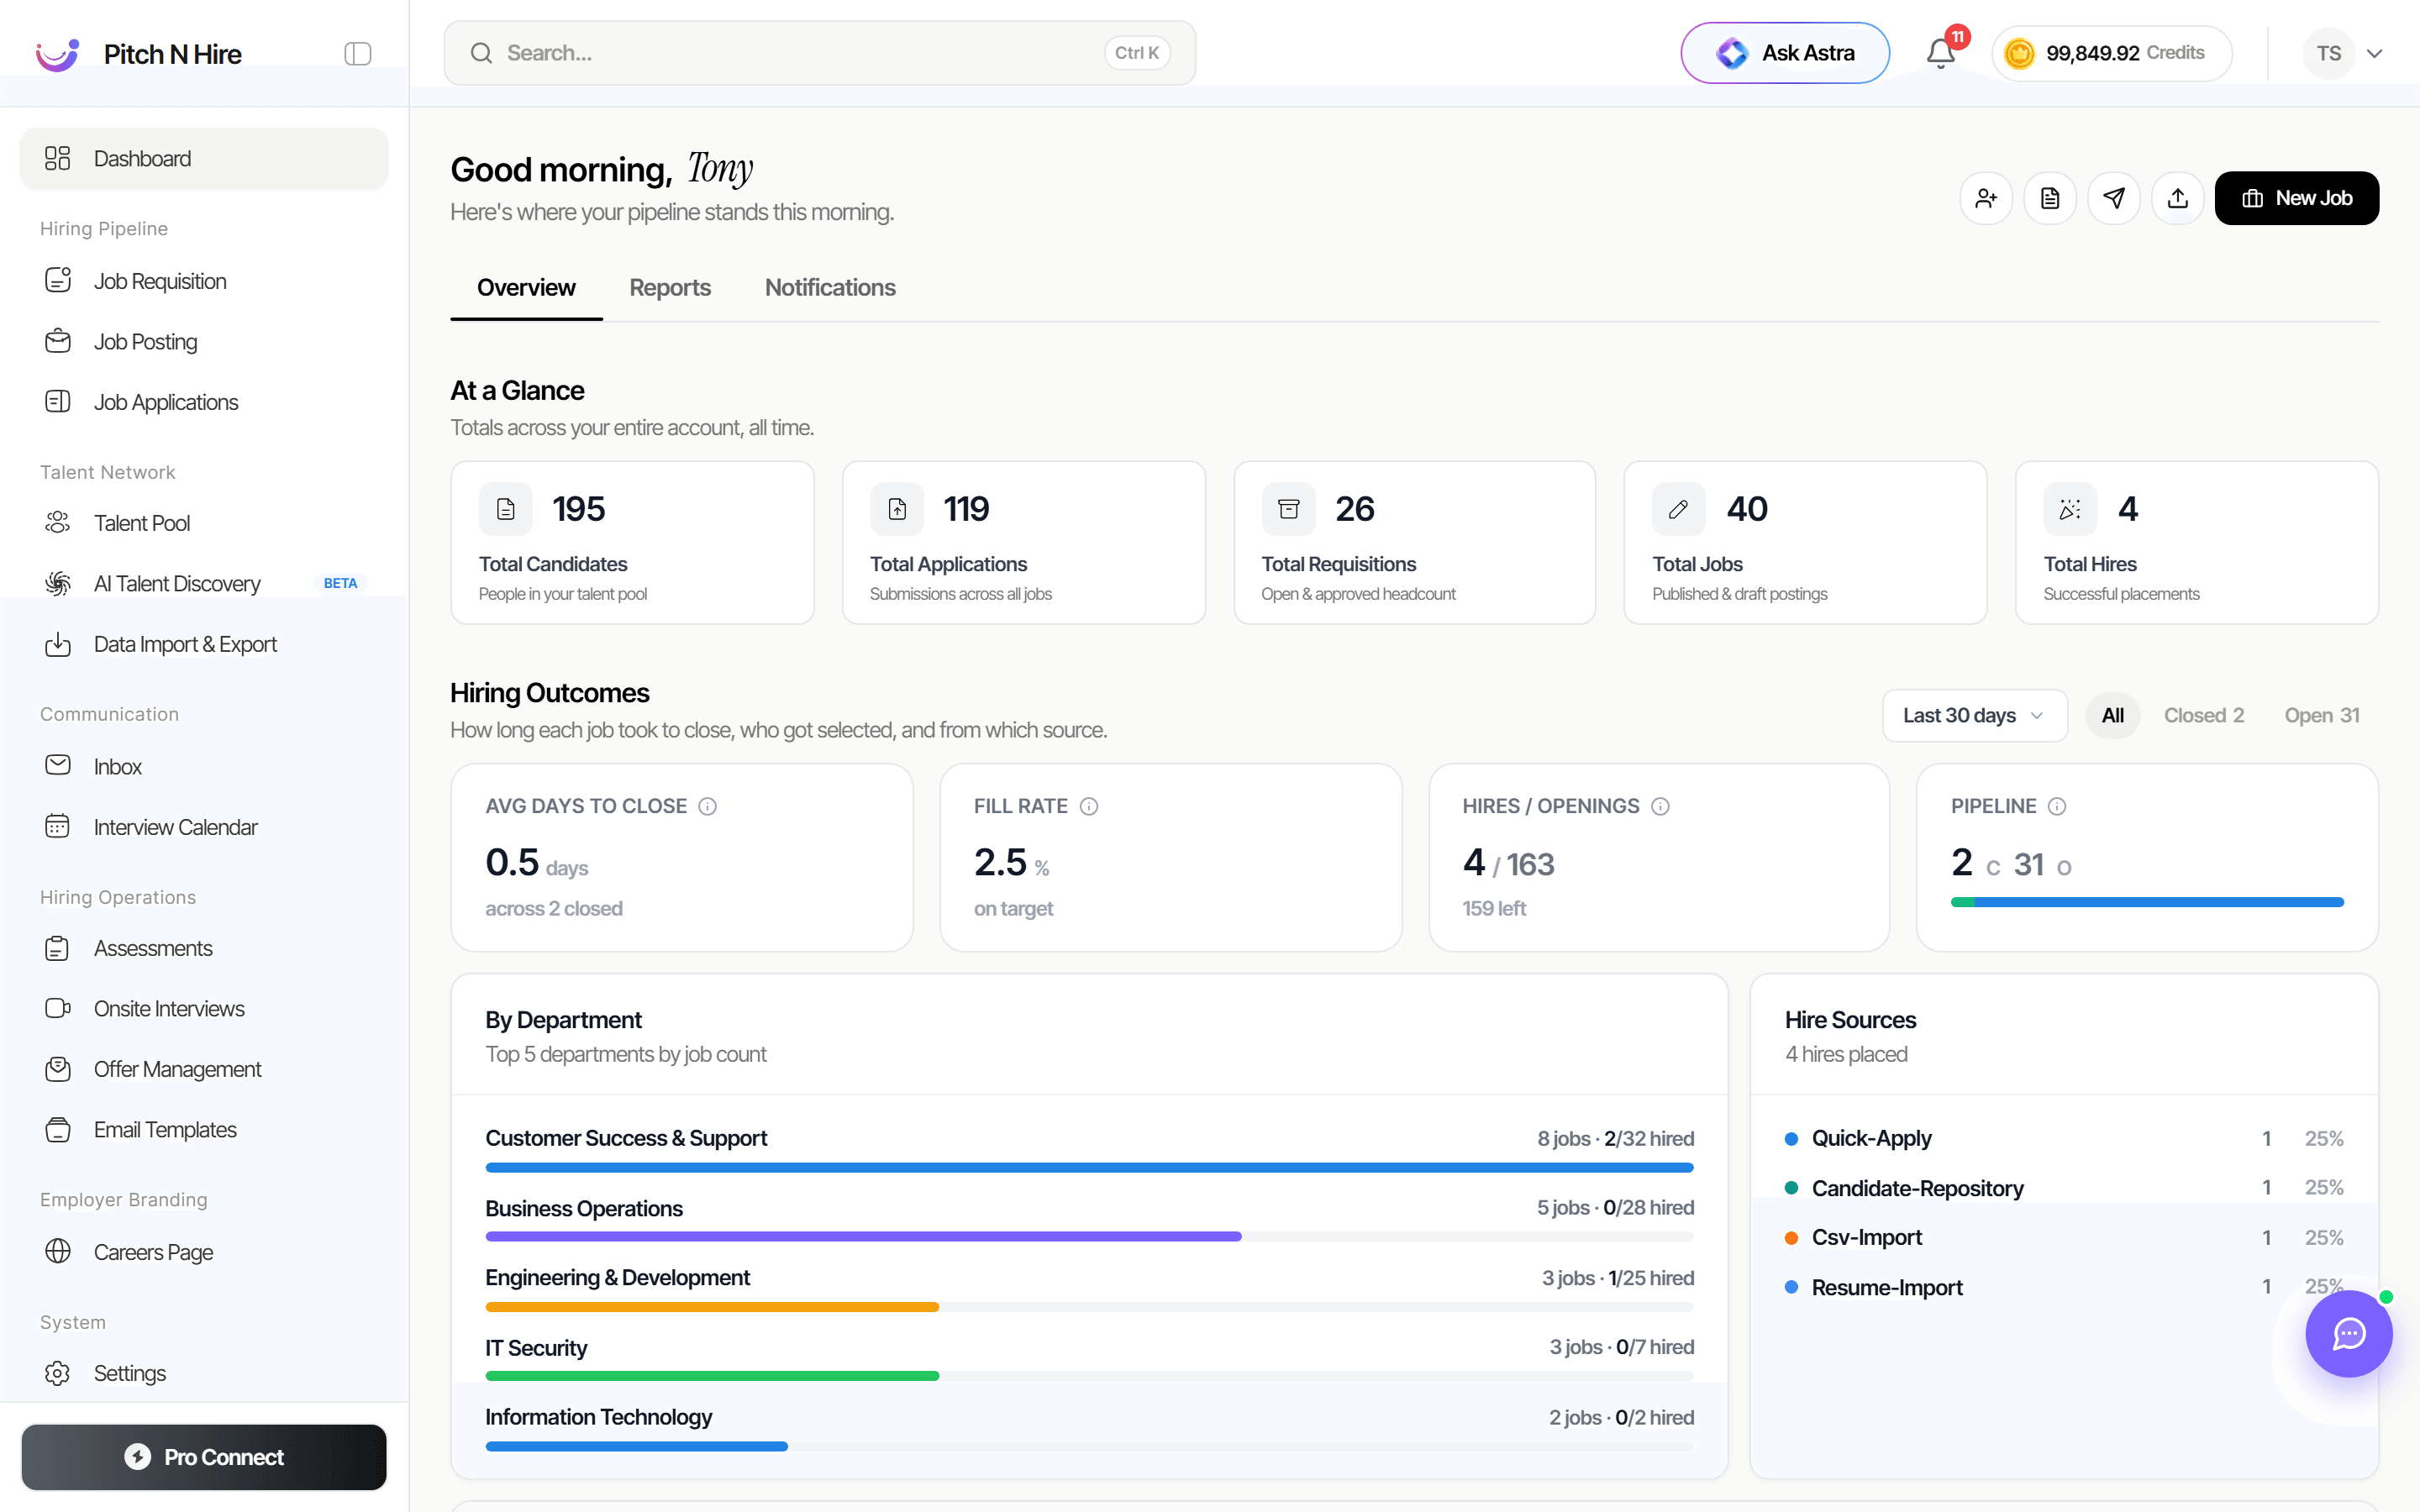
The Dashboard opens on a personalised greeting (“Good morning, Tony”) and is organised into three tabs, Overview, Reports and Notifications. The Overview tab leads with the At a Glance band and the Hiring Outcomes metrics, then breaks performance down By Department and by Hire Sources. A persistent top bar runs across every tab with global search, the Ask Astra assistant, your credit balance and a quick New Job button.
Key features
- Top bar tools available on every tab: a global Search (with the
Ctrl Kshortcut), the Ask Astra AI assistant, your live Credits balance, and a one-click New Job button. - Overview / Reports / Notifications tabs to switch between a quick summary, deeper analytics, and product updates and activity alerts.
- At a Glance stat cards summarising your whole account, all-time: Total Candidates, Total Applications, Total Requisitions, Total Jobs and Total Hires.
- Hiring Outcomes cards: Avg Days to Close, Fill Rate, Hires / Openings and Pipeline, with a date filter (e.g. Last 30 days) and All / Closed / Open toggles.
- By Department bar chart ranking your top 5 departments by job count, with jobs and hires per department.
- Hire Sources breakdown showing where placed candidates came from (Quick-Apply, Candidate-Repository, Csv-Import, Resume-Import) as counts and percentages.
Step-by-step
Read your pipeline at a glance
- Open Hiring Pipeline -> Dashboard and stay on the Overview tab.
- Scan the At a Glance cards for account-wide totals, candidates in your talent pool, applications across all jobs, open and approved requisitions, published and draft postings, and successful placements.
- Review Hiring Outcomes to judge pipeline efficiency, Avg Days to Close, Fill Rate, Hires / Openings and current Pipeline count.
- Use the date dropdown (e.g. Last 30 days) and the All / Closed / Open toggles to scope the outcome figures to the period you care about.
Dig into reports
- Click the Reports tab.
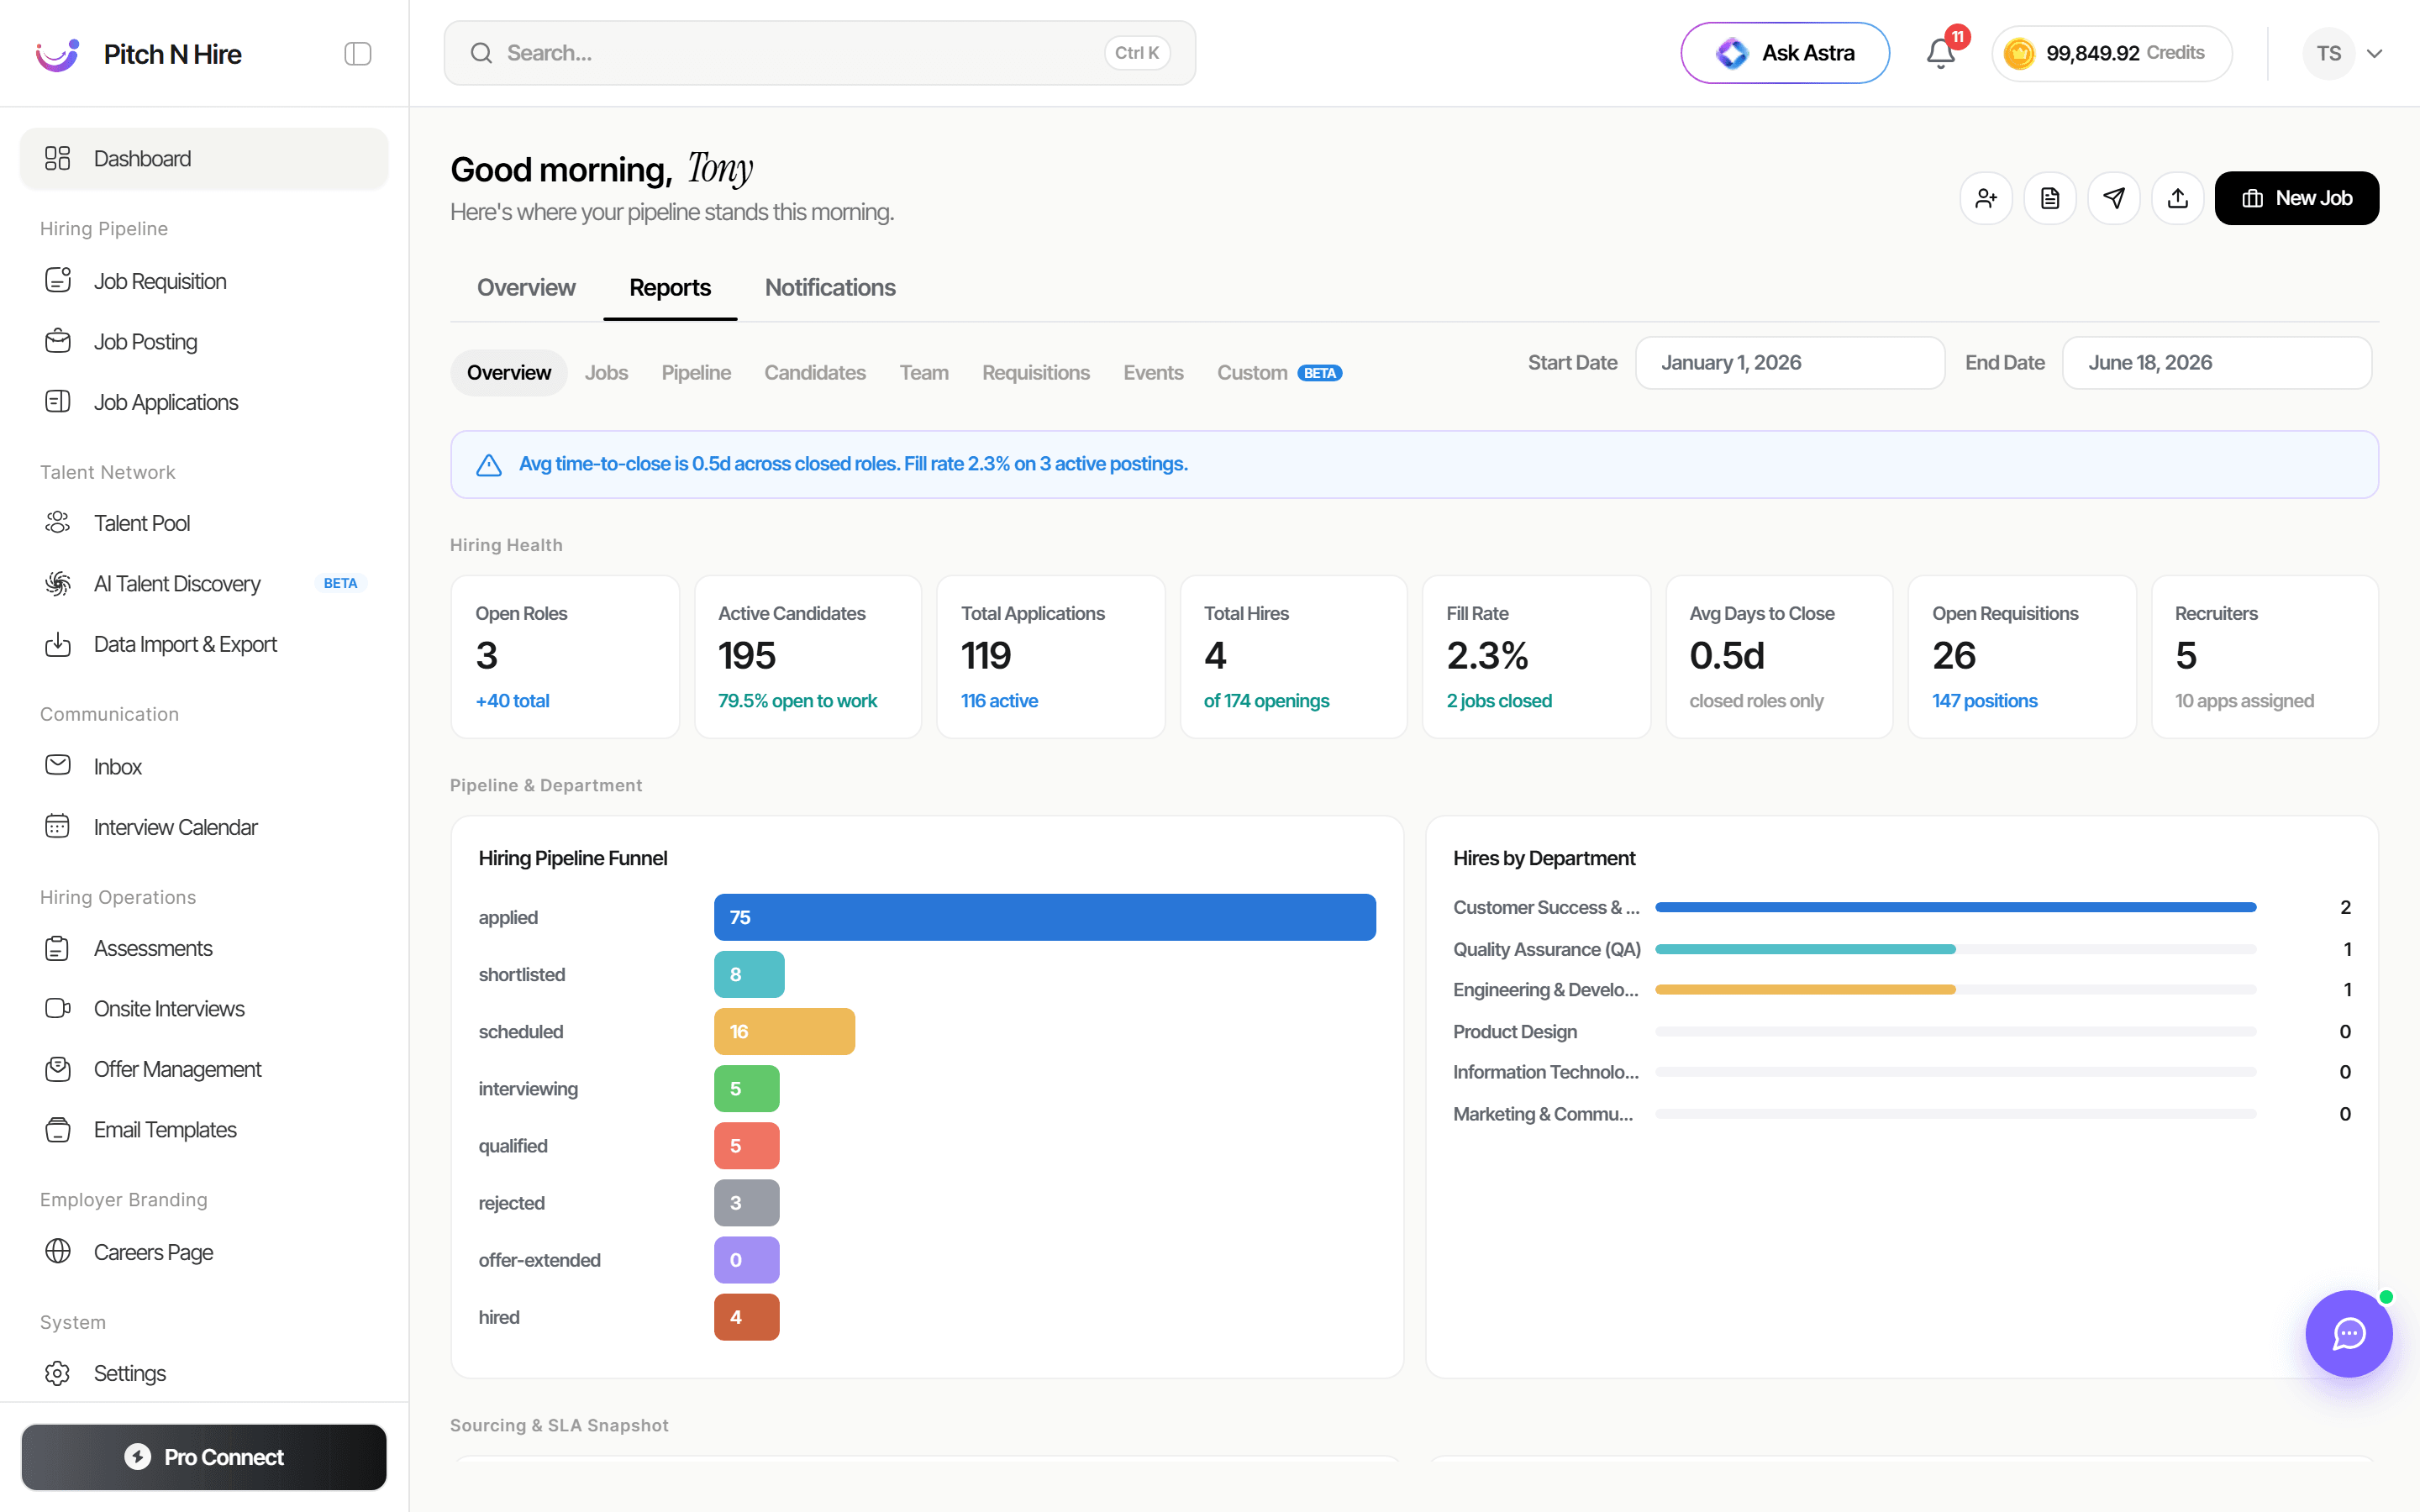
- Choose a sub-view from the report tabs, Overview, Jobs, Pipeline, Candidates, Team, Requisitions, Events or Custom.
- Set the Start Date and End Date to define your reporting window.
- Read the Hiring Health strip (Open Roles, Active Candidates, Total Applications, Total Hires, Fill Rate, Avg Days to Close, Open Requisitions, Recruiters) and the Hiring Pipeline Funnel and Hires by Department charts below it.
Stay on top of updates and activity
- Click the Notifications tab.
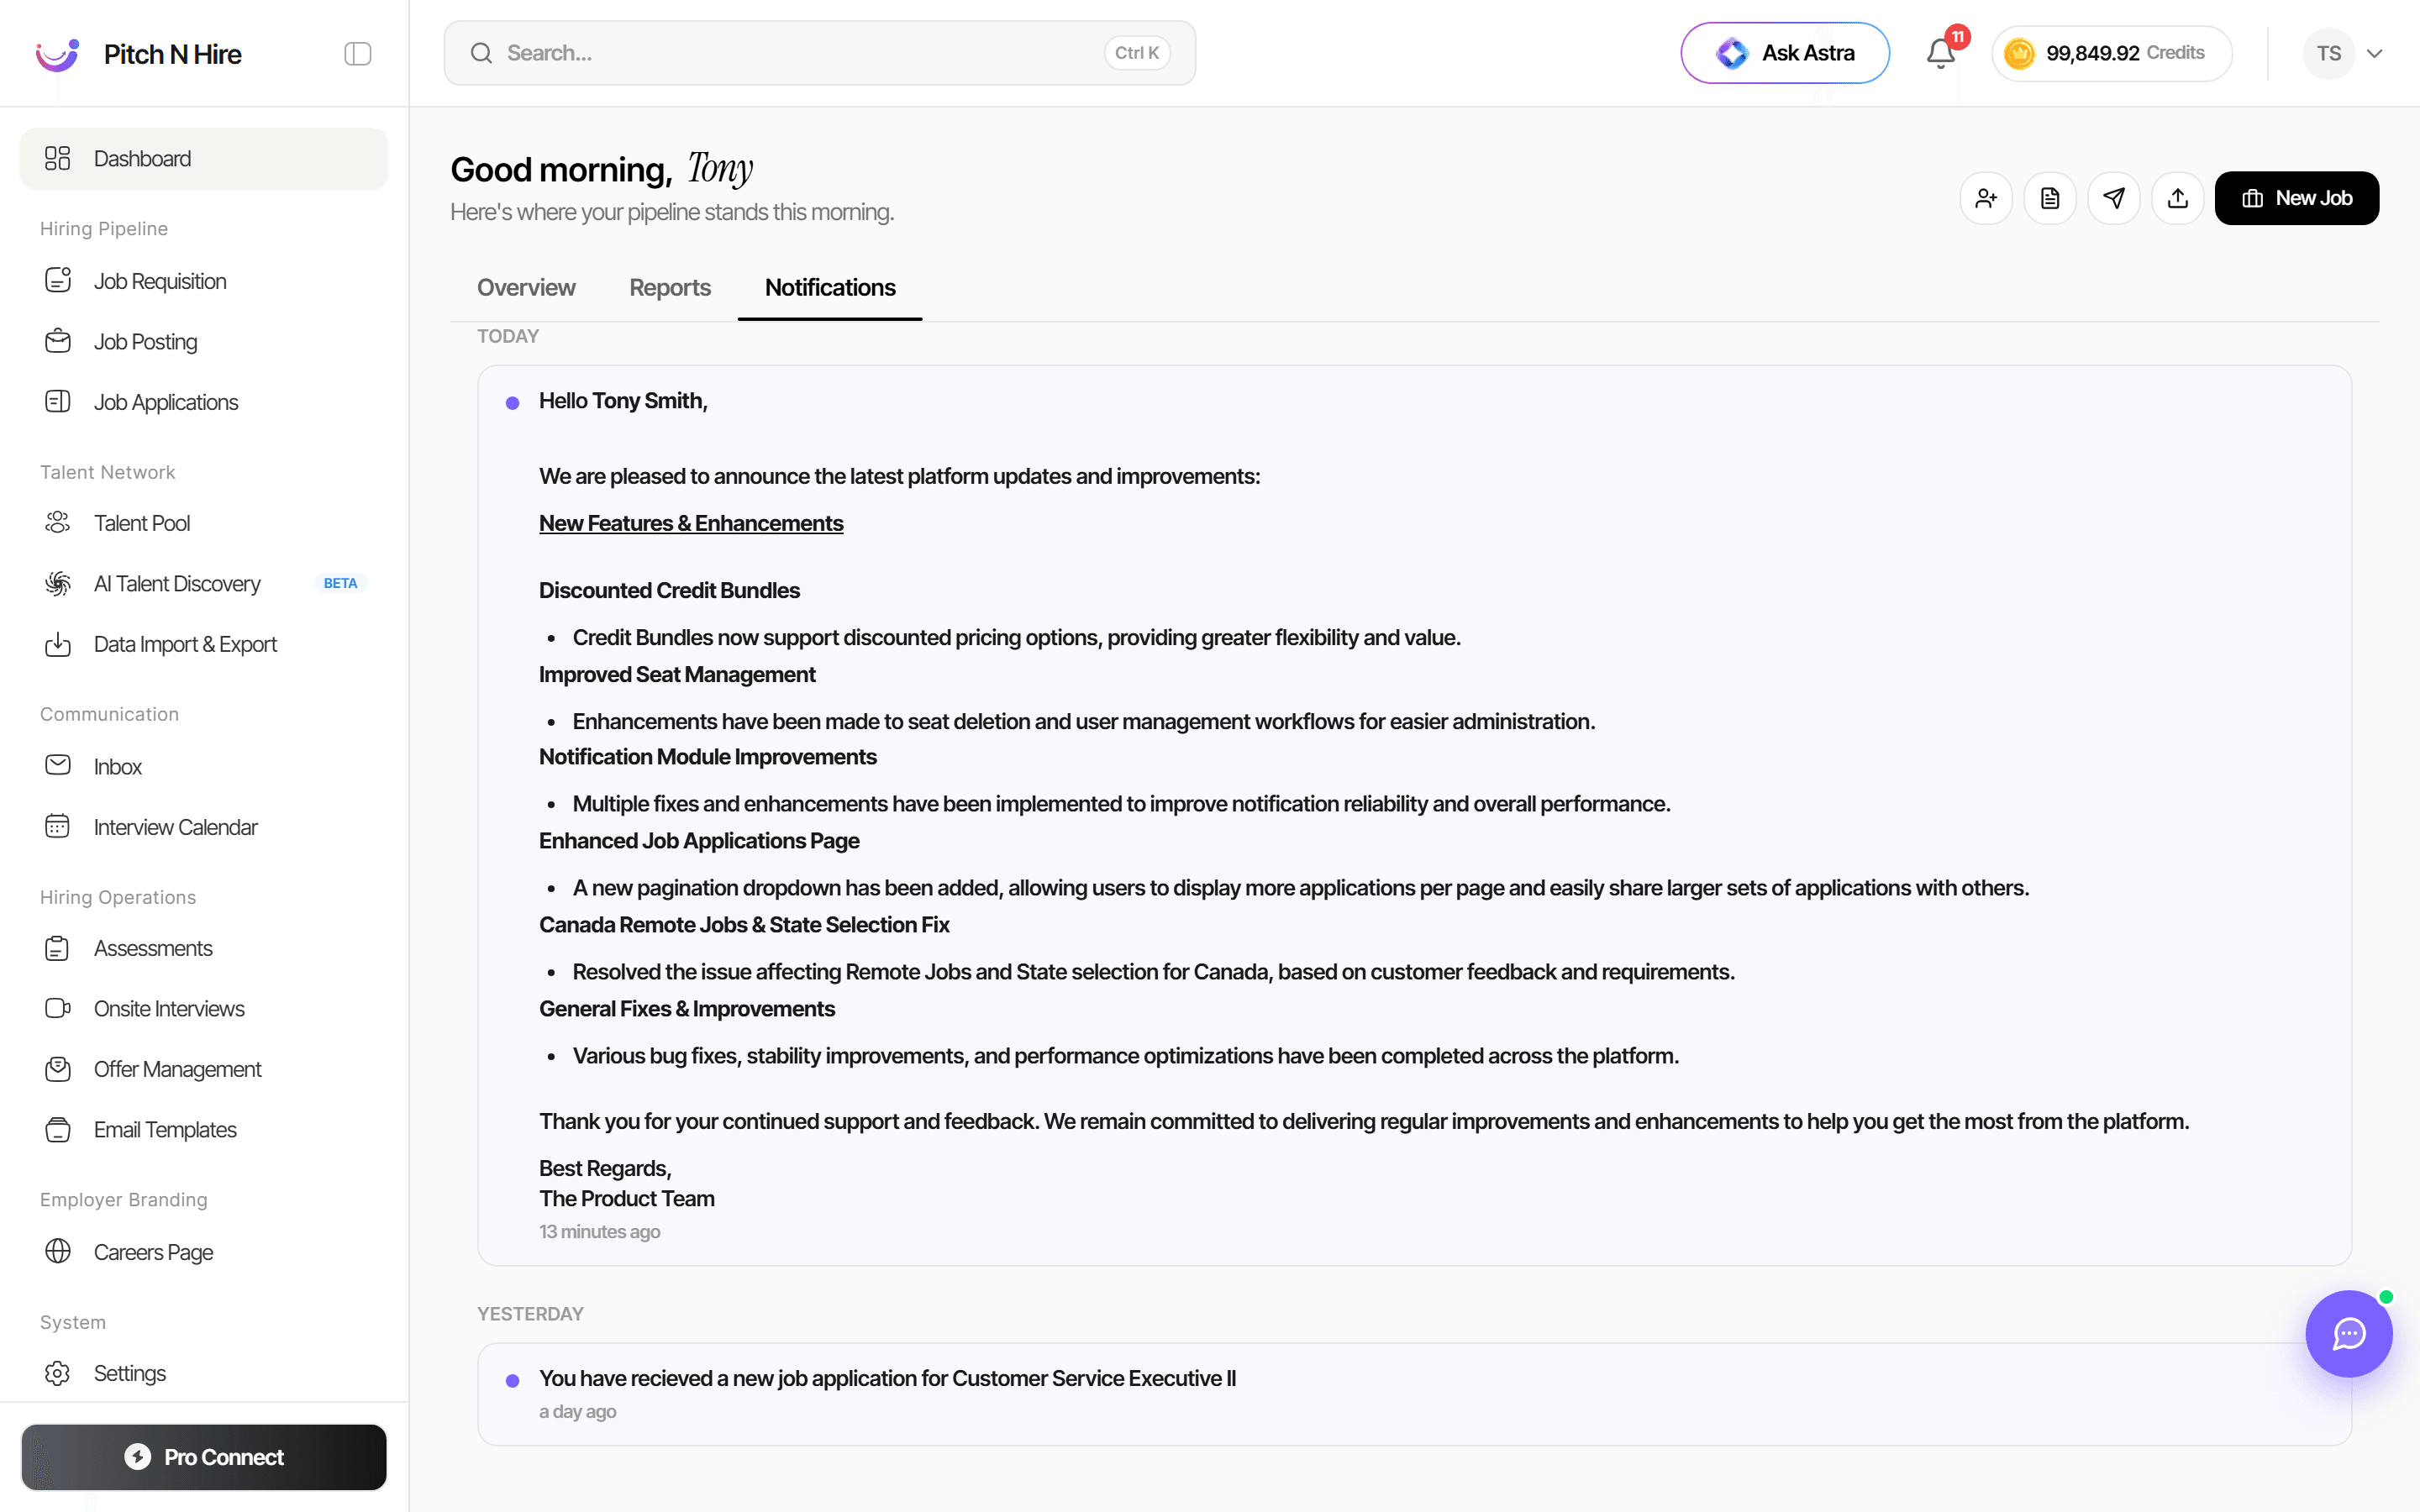
- Read product announcements (new features and enhancements) at the top of the feed.
- Scroll to Yesterday and earlier to catch activity alerts such as new job applications received.
Tips
Common issues & fixes
- Stat cards show zero or look empty - no data yet for your account - add candidates, raise requisitions and publish jobs; At a Glance reflects all-time totals once activity exists.
- Hiring Outcomes numbers seem off - the date filter or All/Closed/Open toggle is narrowing the data - widen the date range or switch the toggle back to All.
- Notifications feed looks stale - the page was open a long time - refresh the browser to pull the latest announcements and activity alerts.
- Credits balance not updating - cached view - refresh; if it persists, check Settings -> Credits for the live balance.